Finally got around to hooking my new Red Pitaya up to the PA0KLT VFO and having a play around with the oscilloscope and spectrum analyser applications. Very easy to hook up on the dining table, connected to the laptop via WiFi and seems fairly responsive given that it’s driven through a web browser so a minimum of cables out on the table:
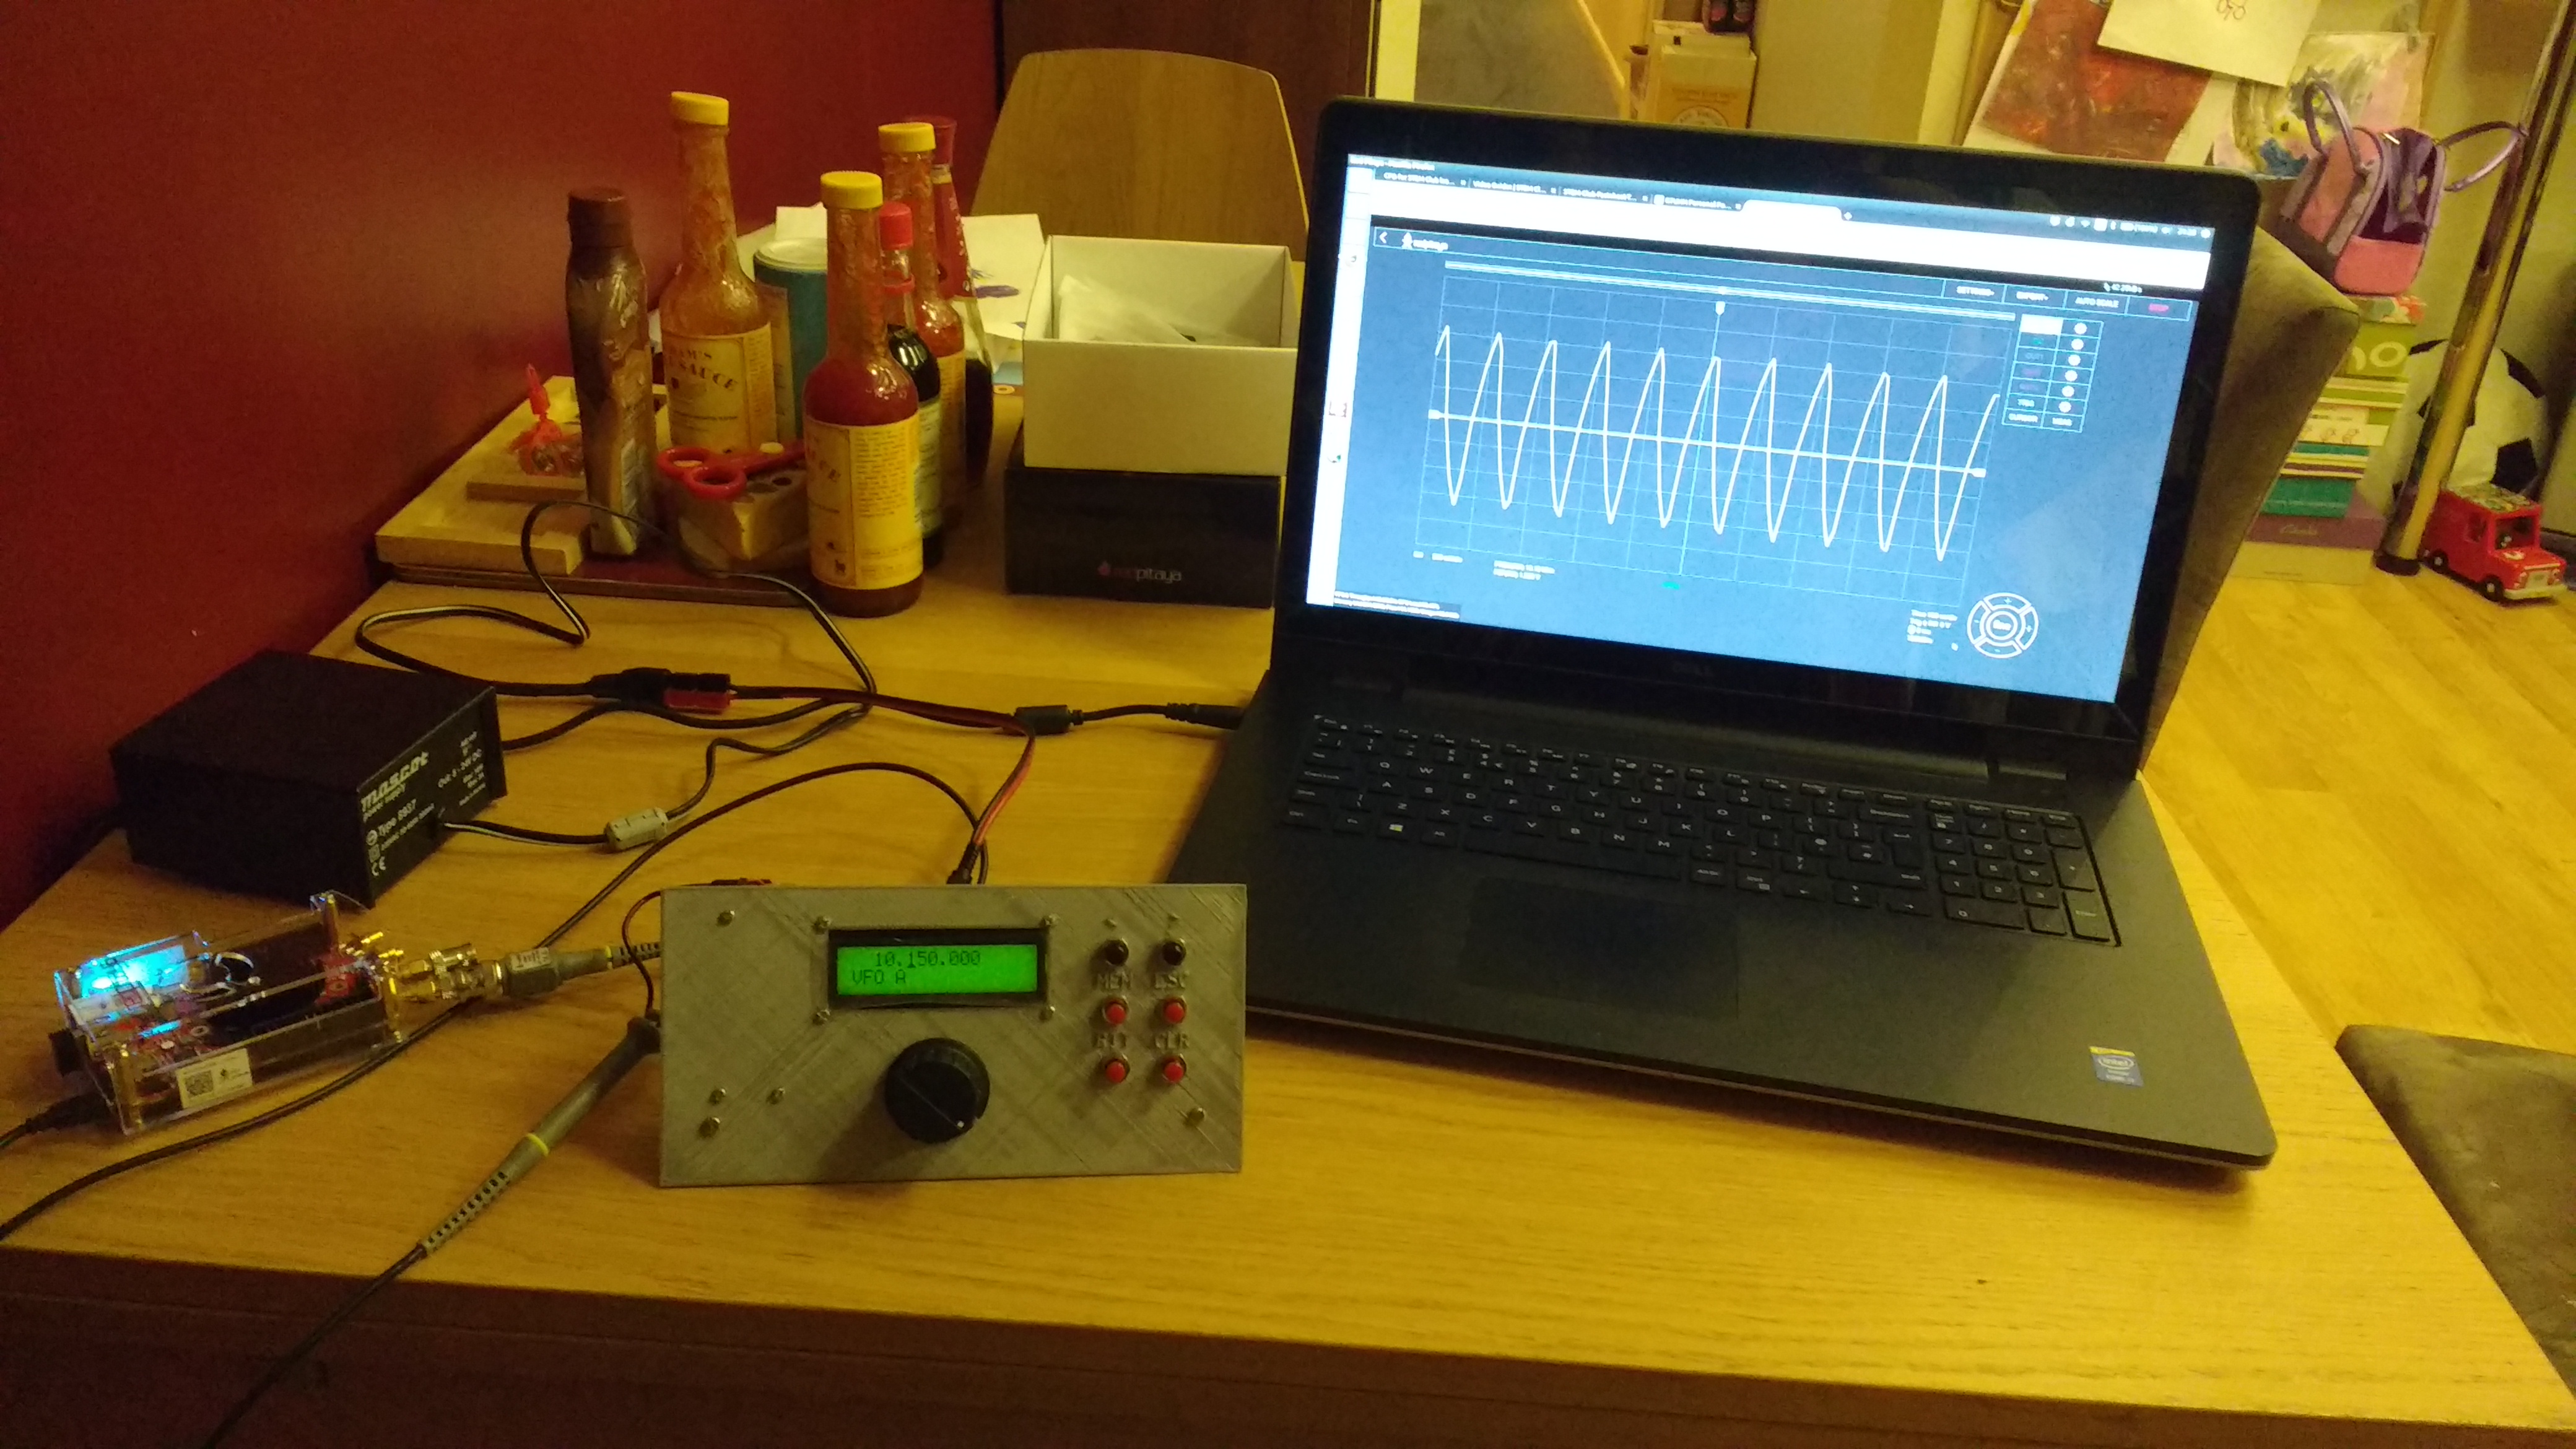 Basic operations on the scope seem easy enough:
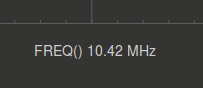
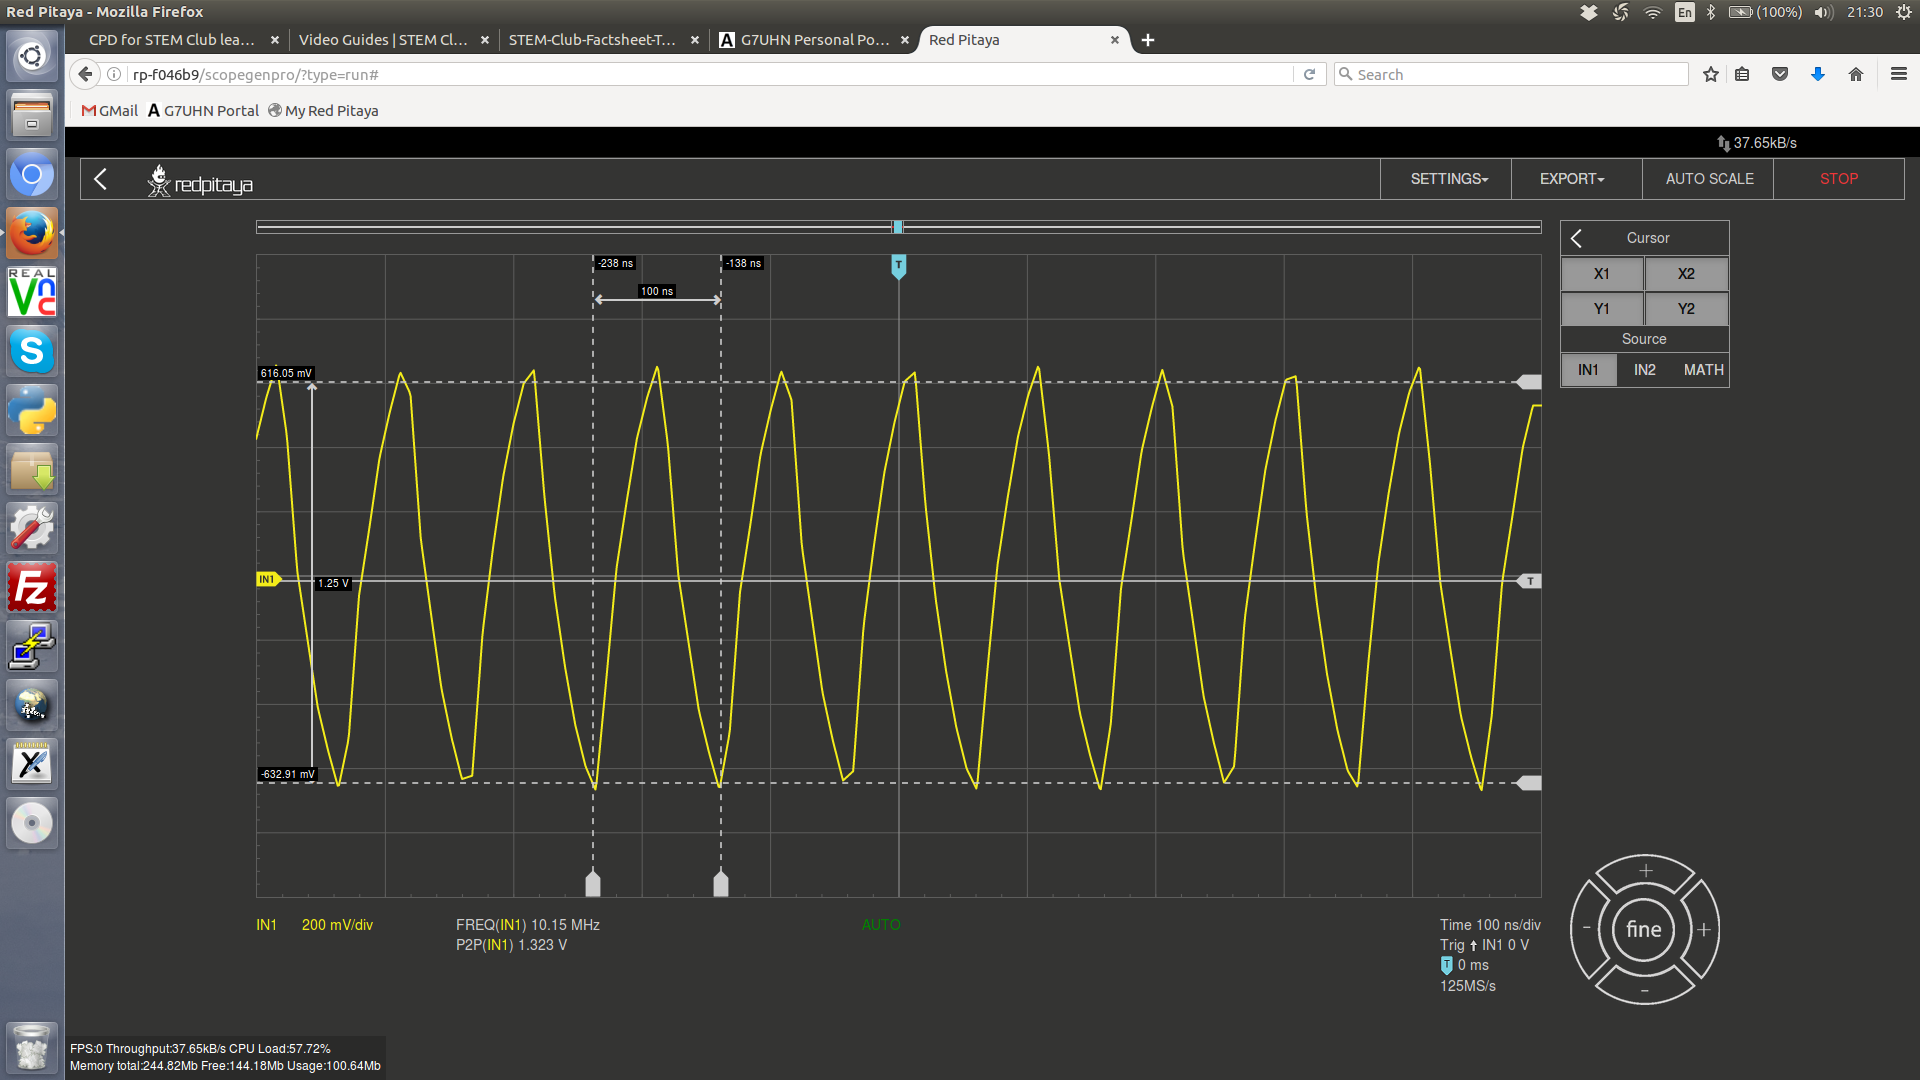 The frequency measurement on the scope appears fairly accurate (the VFO isn’t calibrated yet) but the precision seems limited to 4 significant figures, not so useful when you move above 10 MHz:

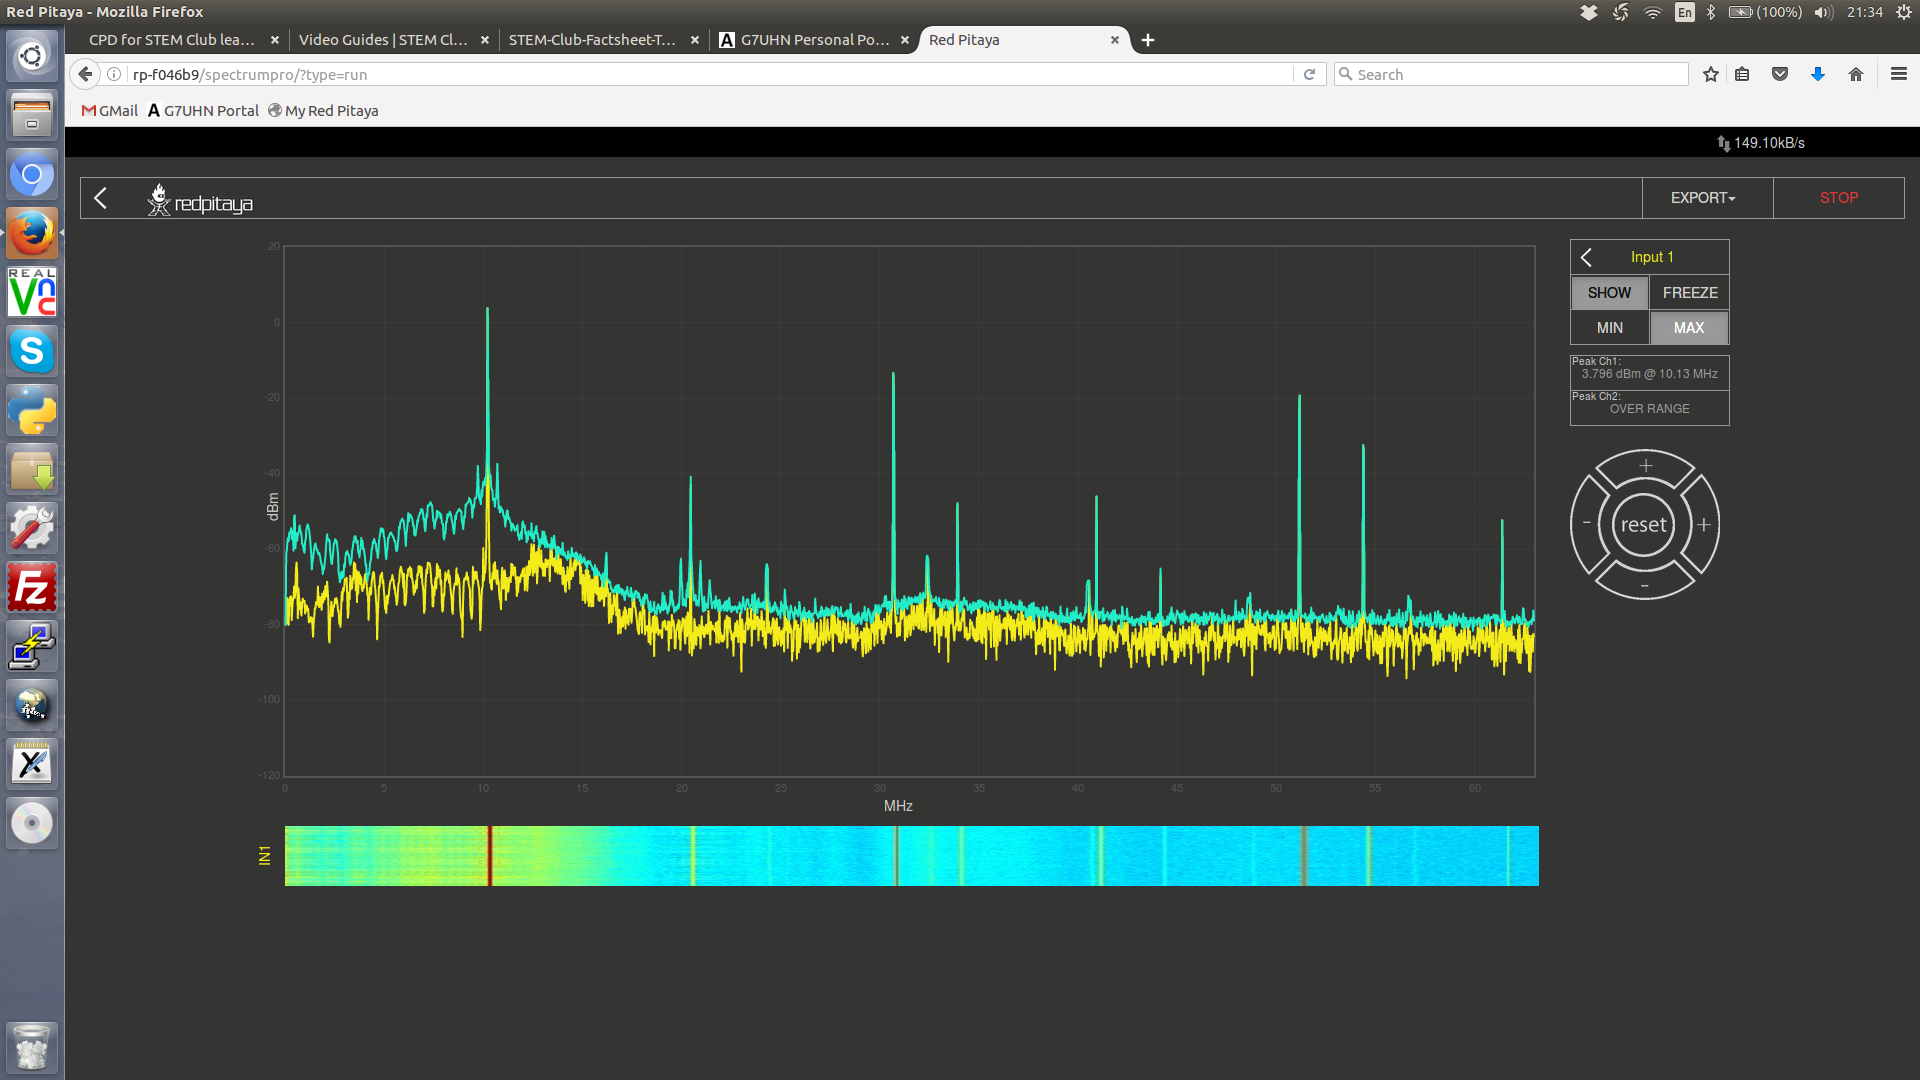
 The “Spectrum Analyzer Pro” application seems pretty basic and I couldn’t figure out how to set the span to a smaller range, need to do some reading I think. The trace shows a lot of noise in the lower part of the spectrum, could be local interference (I’m staring at the Red Pitaya’s own tiny switch-mode power supply…):
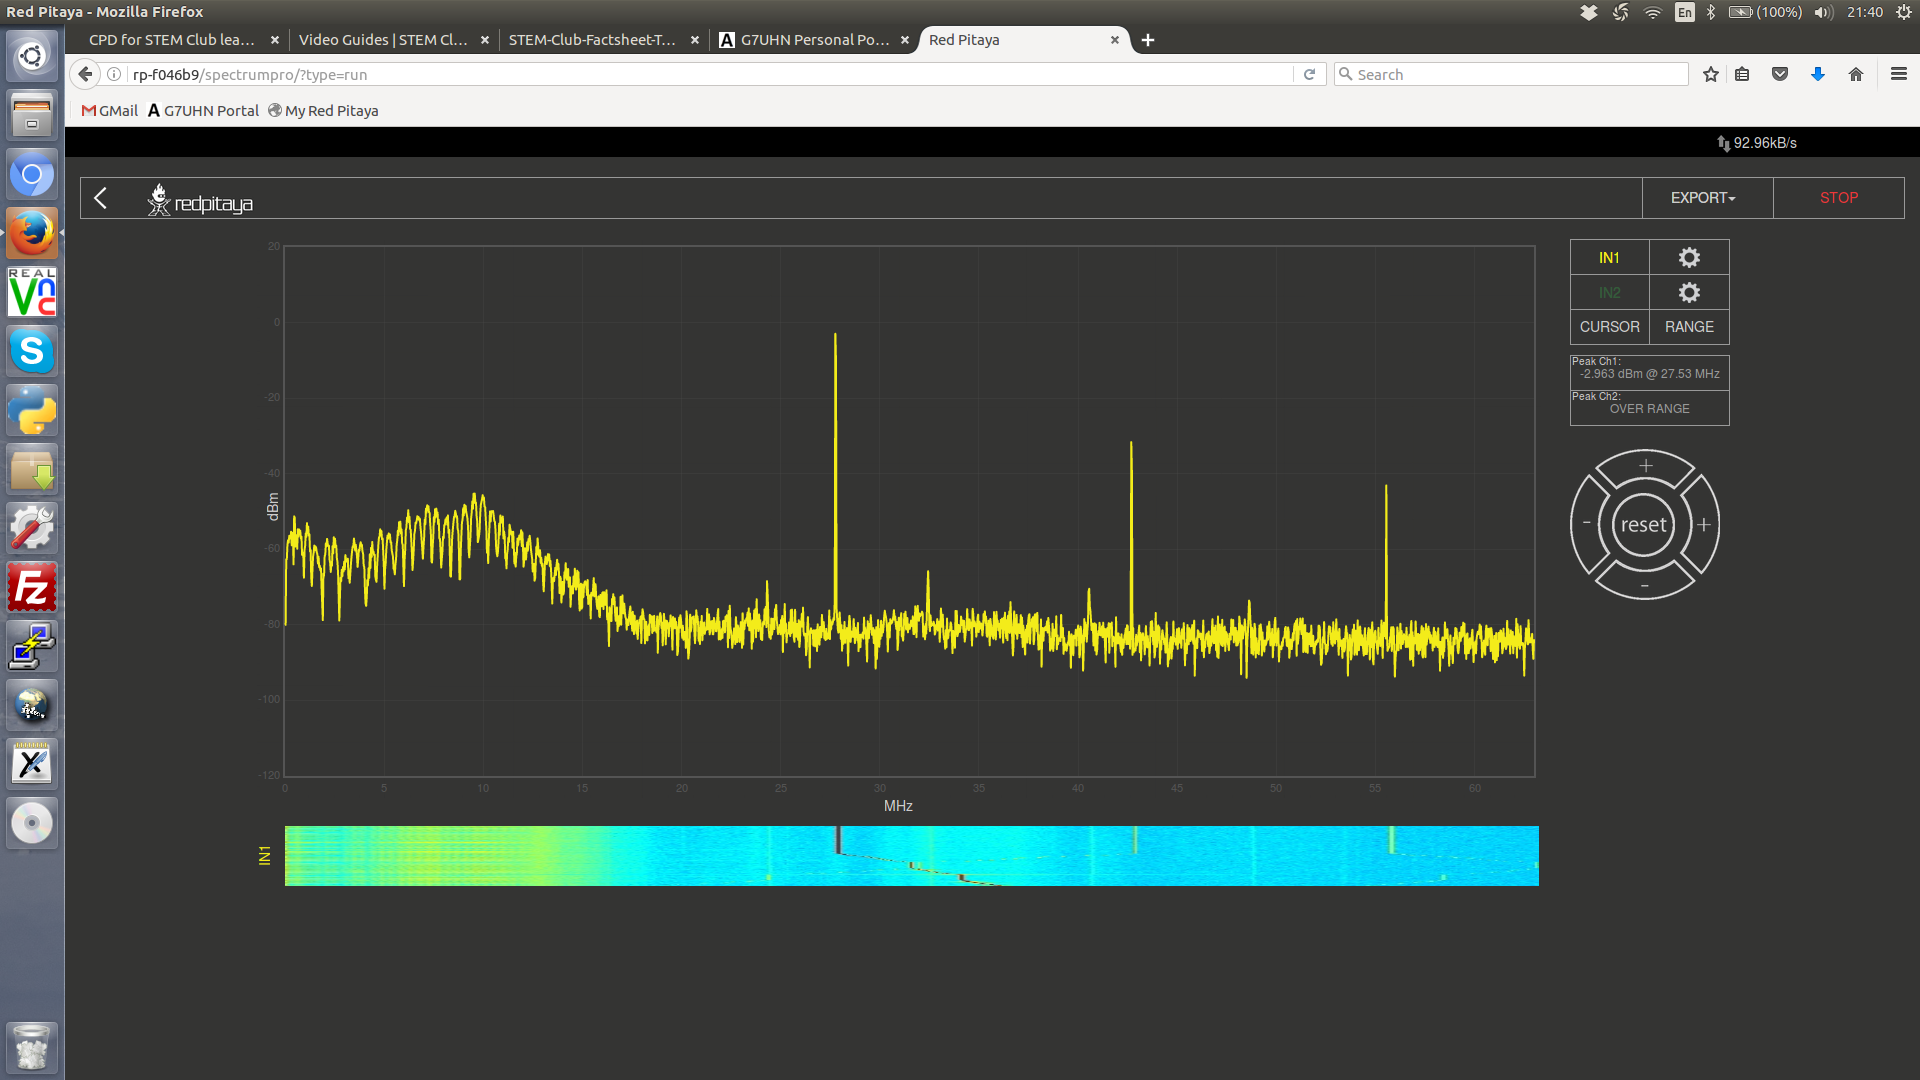
 Winding the VFO up in frequency moves it out of the noise:
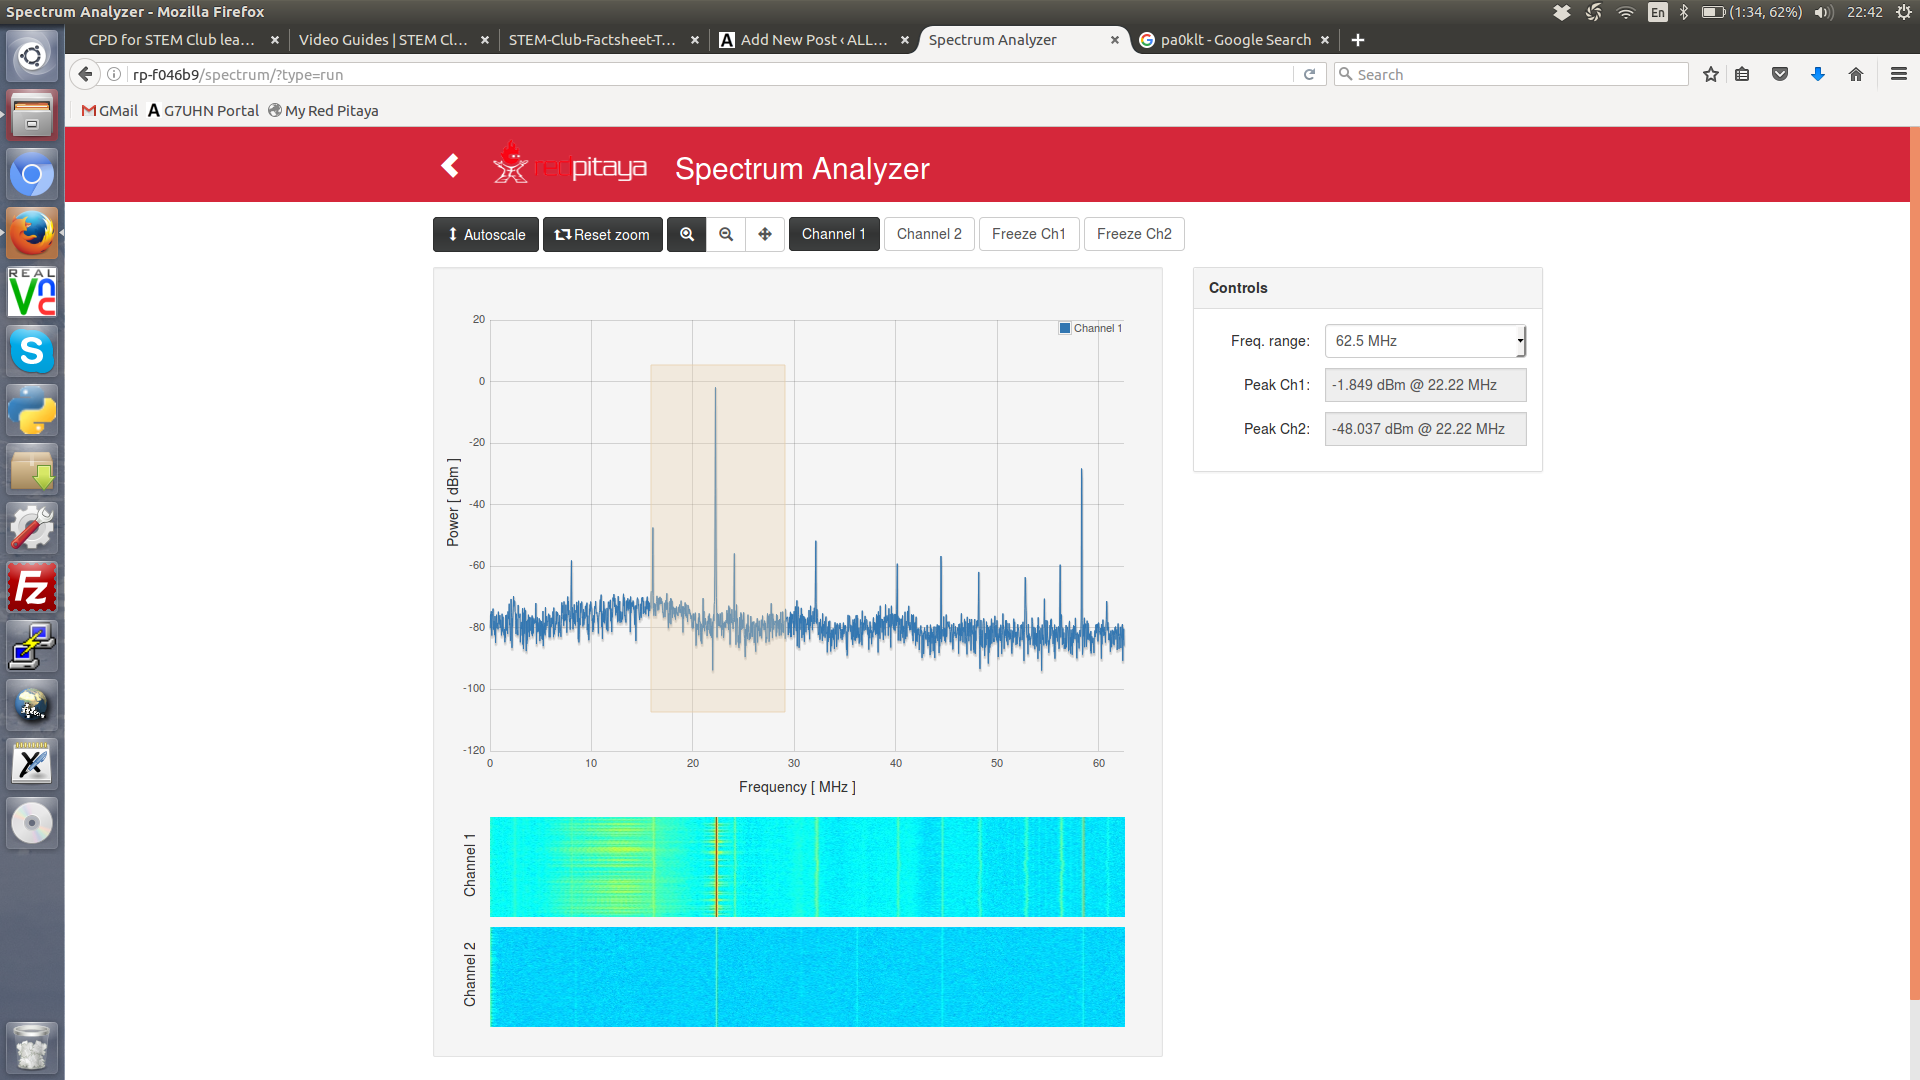
 The previous version of the spectrum analyser is still available in the Application Marketplace and that seems to be more usable despite the smaller display area. It seemed quite obvious that you could zoom in by selecting the zoom control and drawing a box around the area of interest:
 To finish off I’ve had a little look at the digital capture of the oscilloscope to visualise the switch bounce problem I have on the PA0KLT VFO (100nF capacitors across each switch are listed as “optional” and not included in the kit but I’m thinking they’re probably “essential” and will be fitting some this week!):
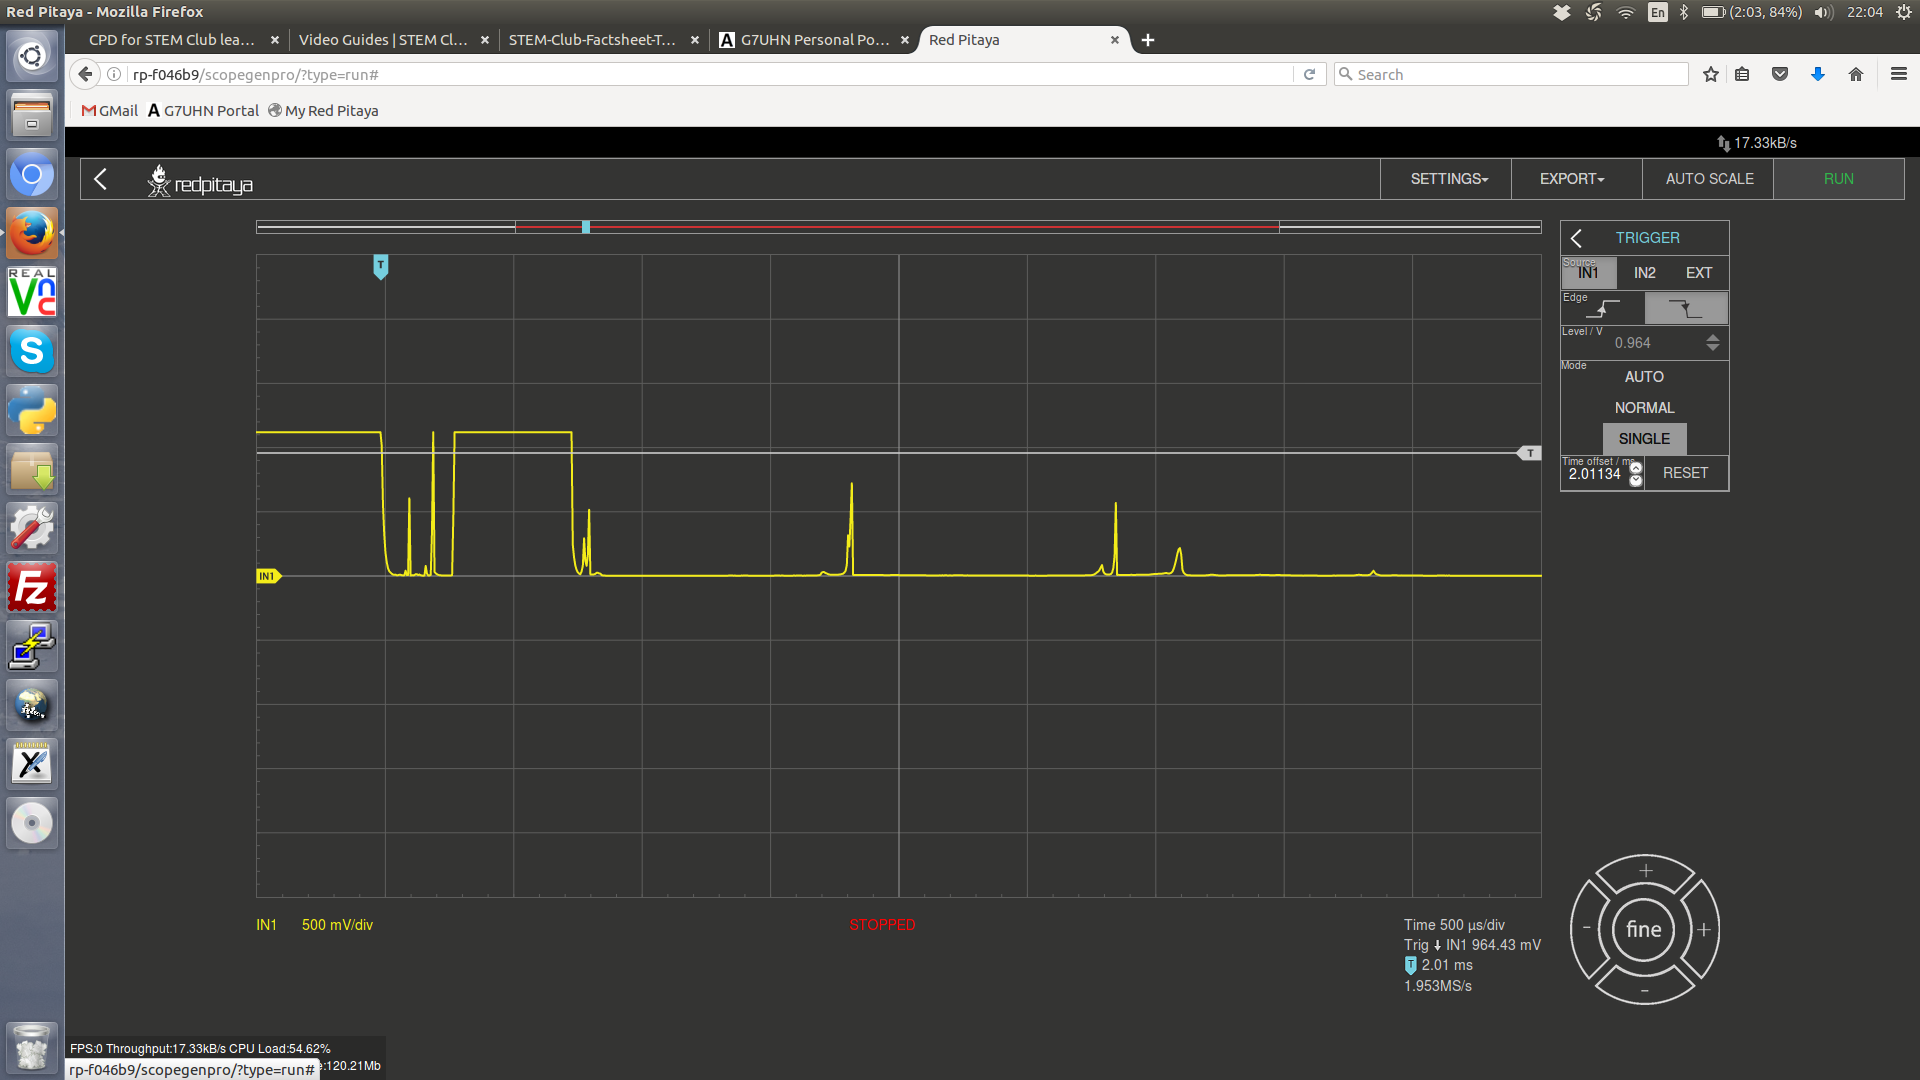 Panning left and right on a scope capture seems a little clunky (you can drag the bar/trigger point at the top of the display but the trace only updates when you release the drag), hopefully someone will improve this.