I’ve been spending a lot of time over the last year playing with weather satellite reception, specifically the NOAA APT satellites, NOAA 15, 18 and 19, that broadcast their imagery in the 137 MHz band. These are surprisingly easy to receive with basic equipment and provide really interesting imagery of the current weather overhead.
There’s lots of tutorials out there on the web about the many methods there are of receiving these signals so I won’t replicate those here, this page is intended to outline my particular setup and show some of the results. One of the aims of my setup is to see what can be achieved at low cost to support a school project detailed elsewhere on this site.
System overview

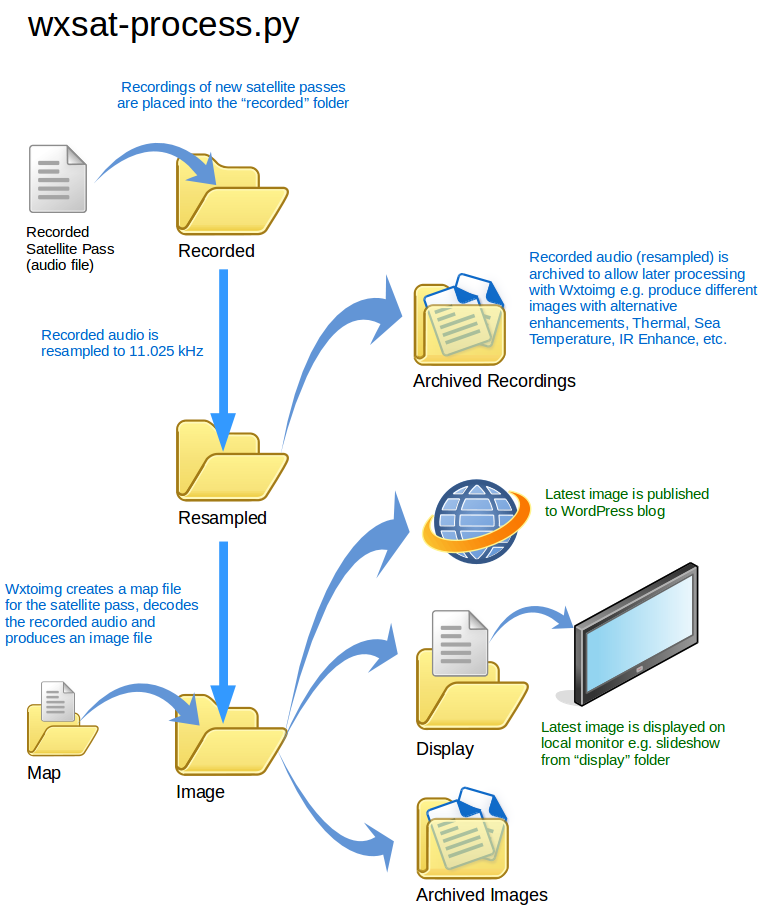
Click on the system diagram above for an overview of the setup here. Basically a Raspberry Pi 3 (RPi3) is the star of the show running the satellite prediction software, software-defined radio and image decoding software. A couple of Python scripts also run on the RPi3 to control automatic recording of the satellite passes and process the recorded files, opening them in Wxtoimg for decoding into basic images and then upload to a website for review. This allows me to easily sort through the (many) noisy images of low elevation or night-time passes and recognise the passes that have produced good images for further processing. OK, let’s go through it in a little more detail below…
Antenna
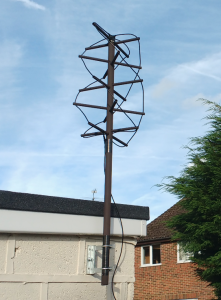 The antenna I’ve built for this purpose is a Quadrifilar Helix (QFH) type based on G4ILO’s notes. I’ve added some extra horizontal struts to keep the helix shape better in the wind and also strengthened the main mast by inserting a steel clothes rail (a perfect fit into the plastic pipe) inside the lower section of the mast where the clamps are holding it to the wall bracket. The antenna is mounted deliberately low on my garage to avoid exposing it to the full breadth of pager interference in the local area. It’s a compromise and really just a first attempt to get something up and running. Over time this will be compared against the active V/UHF antenna I have installed my chimney. Nevertheless, the QFH antenna seems to do quite well.
Low Noise Amplifier
My one extravagence in this setup is the inclusion of a Low Noise Amplifier (LNA), specifically an LNA4All. It’s still a relatively low cost item at about £40 delivered to the UK but it’s the most expensive component in use here. The LNA is placed almost immediately after the antenna (there is about 2.5m of RG58 cable between the antenna and LNA).
RTL Dongle/ Raspberry Pi
RTL SDR dongles again, specifically one from RTL-SDR.com where they supply dongles with the 1PPM temperature-controlled oscillator to reduce the number of settings that have to be fiddled with (important for the use in schools). The dongle receiver is now run from a Raspberry Pi 3 (I previously used a BeagleBone Black to make this dongle available on my home network and hosted the SDR software on an old spare laptop in the house, the same way I run my other network receivers). Wired networking is used to connect the RPi3 to my home network and I operate this system mostly via the VNC desktop shown below.
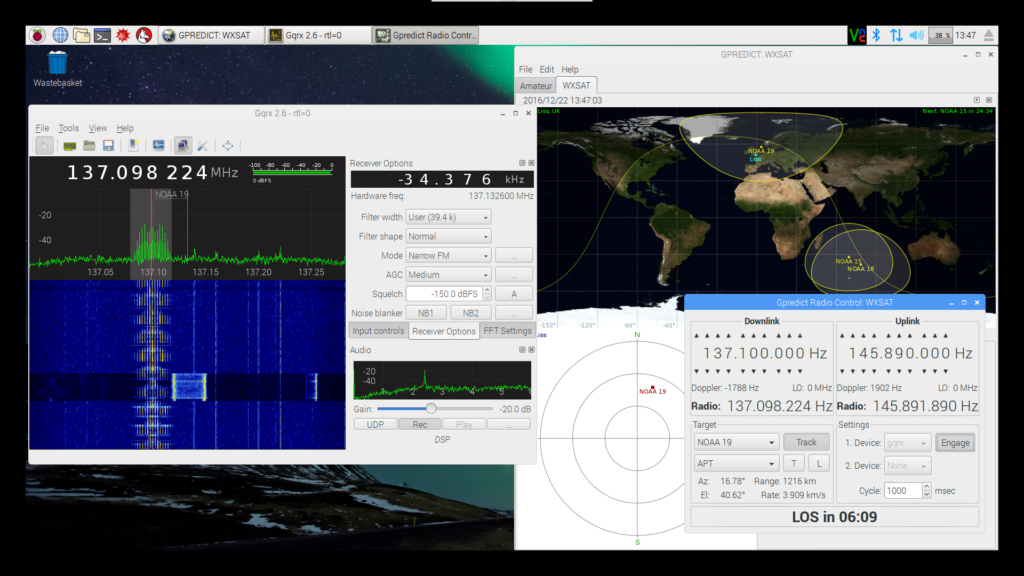
For ‘live’ use, the software component of the receiver is Alexandru Csete’s excellent GQRX SDR application. This now runs on Raspberry Pi (2 and 3) although care needs to be taken with some of the settings to avoid working the RPi3 CPU too hard. For ‘automatic’ use the receiving software is rtl_fm, see below for a description of that setup.
Settings I use for weather satellite reception on GQRX:
- Dongle sample rate: 300000 (set fairly low in an attempt to narrow the bandwidth of the receiver and lower its susceptibility to pager interference on nearby frequencies)
- Dongle LNA gain setting: 44dB (set really high even with the additional LNA4All in the system, I’m sure there’s scope for reducing this but I haven’t tried yet)
- Demodulation mode: NFM, max deviation = 25kHz (APT setting), Tau = Off
- Filter bandwidth: about 38 kHz (GPredict will control the Doppler correction on the receiver so I don’t need to set this any wider than is necessary for the APT signal)
Settings specifically to reduce the CPU load on the RPi:
- Lower FFT refresh rate to 10 frames per second or lower
- Don’t run GQRX full screen, use a small window size to set GQRX running and then minimise during operation – not having to display the spectrum and waterfall has a big impact on RPi CPU loading
Processing The Recorded Audio
Recorded satellite passes are decoded using free software – wxtoimg is a very popular application for this. I simply open the audio files in wxtoimg after they have been recorded (wxtoimg can also be run from the command line and that aspect is used in my automatic setup, see below).
Some tip and tricks I’ve learned here:
- Change the sample rate – Linux works natively at 48 kHz sampling rate and so that’s the rate GQRX records at. Wxtoimg only accepts audio files at 11.025 kHz sampling rate. Use “sox” in Linux to resample the recorded audio files e.g. “sox <existing-filename> <new-filename> rate 11025”.
- Correct the “file modified” time – Wxtoimg generates map overlays and false colour for land masses if it matches the created/modified time of the audio file to the time of a satellite pass. Initially I thought this was based on the filename (all the SDR programs seem to include the recording start time in the filename by default) but it’s actually the file properties that wxtoimg looks to when determining the satellite pass that corresponds to an audio file. So, given that we’ve had to create new audio files during the resampling process in Linux, how can we get wxtoimg to match them to the right satellite pass? Change the file properties to match those of the original recorded audio file – use the “touch -r <file1> <file2>” command in Linux to copy the file properties from file1 to file2. Another useful technique is to create a new file with the accessed/modified times within the satellite pass time and then copy that file’s properties to the audio file you want to process, some example commands here.
Automatic Recording and Processing
The satellite tracking software application GPredict (also written by Alexandru Csete) can control external radios and Alexandru has written in a neat feature to send messages to start and stop GQRX recording at the beginning and end of satellite passes (a.k.a. Acquisition Of Signal, AOS, and Loss Of Signal, LOS). The key bit of information to get this working is that the AOS and LOS signals to control external recording are only implemented in the development version of GPredict, NOT the version that is in the Ubuntu repo at this time (March 2017). Once I’d followed these instructions to install the latest version from git I found GPredict was happy to control GQRX and could be left running to record all passes of the selected satellite, see screenshot above.
My first intention was to set up an automated system using GPredict controlling GQRX and leave the system running to automatically record and then decode satellite passes 24/7. However, at this time (March 2017), GQRX won’t run for long periods of time on the RPi3 due to a memory leak, it usually crashes my RPi3 after about 15 hours. So, for 24/7 operation, an alternative receiver is required….
Instead of running GQRX (a fully-featured GUI-based SDR) for the automated recording of satellite passes I use the lightweight rtl_fm utility that runs from the command line. rtl_fm is installed as part of the rtl-sdr package so, if you’ve installed rtl-sdr drivers on your system then you probably have it already, otherwise a simple “sudo apt-get install rtl-sdr” will set it up. The key bit of work I had to do here was to come up with a way of starting and stopping rtl_fm based on the AOS and LOS messages sent by GPredict. Fortunately, the GPredict/GQRX interface has been written as a fairly standard hamlib interface of the sort that is commonly used to control amateur radio transceivers. I found that James Ahlstrom has written a hamlib server application in Python and I have modified his code a little bit to recognise the AOS and LOS messages from GPredict. This allows GPredict to connect to this hamlib server and then trigger rtl_fm recordings. When the AOS message is received the server starts rtl_fm recording and when the LOS message is received the server kills the rtl_fm process.
Additionally, I have another Python script running in parallel watching for new recordings. When a new file arrives in a given location a series of commands are run to re-sample the audio, decode the image and display and/or publish to WordPress.
My Python scripts can be found here on github. There general outline of what the scripts do is shown in these two diagrams:
I’m currently writing up a detailed set of build instructions for this project while it is being trialled by a local secondary school STEM club, when the documentation is finished I’ll publish it somewhere…
Results
When I began receiving and decoding wxsat imagery with the RTL dongle last year I was often looking at a lot of interference from local pager transmissions. I can happily say NOAA 15, 18 and 19 are now being received here with very little pager interference on the imagery. The reduction in interference really started when I switched over to rtl_fm for my automatic receiver project and it appears to be a case of finding the right gain settings for each satellite (gain started high and was then progressively tweaked downwards to find a setting of “plenty of gain without overloading the receiver”).
When the automatic receiver system is running, images are being uploaded to this page. The system now generates a few different enhancements of each received image, I might change these from time to time to see what works best with the different satellites. The images are now published to a separate WordPress site to avoid the large quantity of images cluttering up the media library of my main WordPress site, this makes it much easier to manage when I need to do some tidying up.
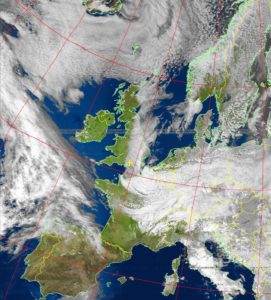
A selection of the best processed images can be found on this page and a good example of my results is below:
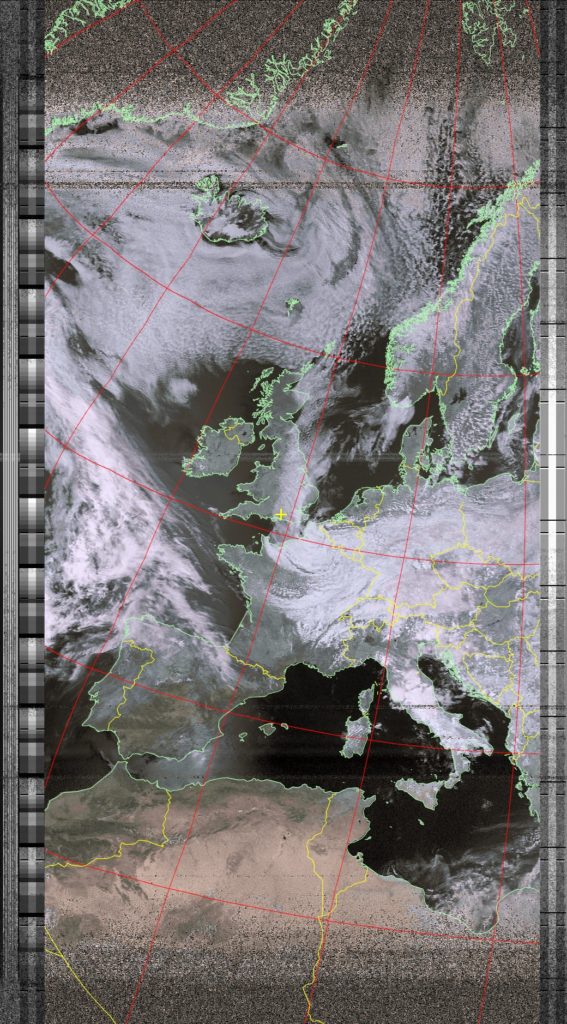
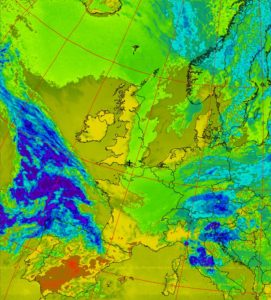
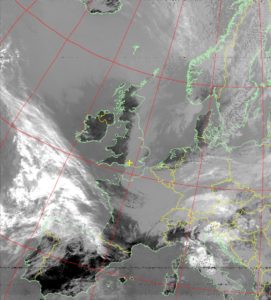
…and some images below from the same capture but different enhancement settings in wxtoimg:
